|
|
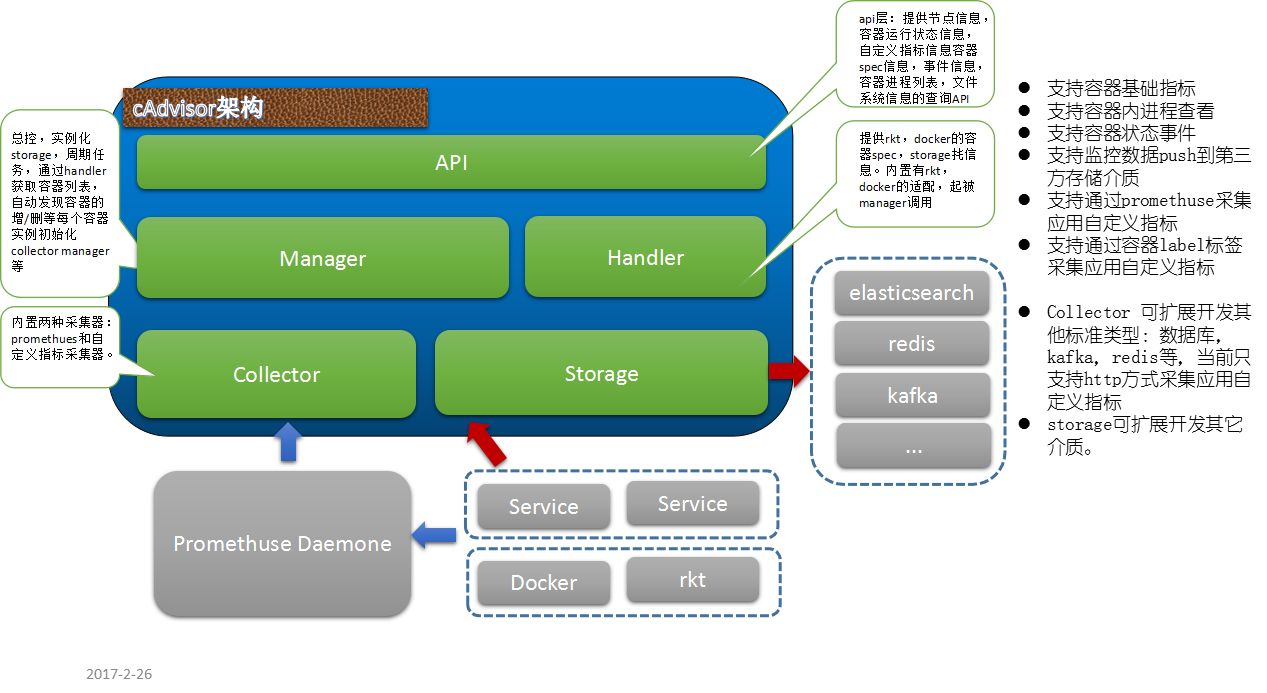
Kubernetes的生态中,cAdvisor是作为容器监控数据采集的Agent,其部署在每个节点上,内部代码结构大致如下:代码结构很良好,collector和storage部分基本可做到增量扩展开发。
关于cAdvisor支持自定义指标方式能力,其自身是通过容器部署的时候设置lable标签项:io.cadvisor.metric.开头的lable,而value则为自定义指标的配置文件,形如下:
{"endpoint" : {"protocol": "https","port": 8000,"path": "/nginx_status" },
"metrics_config" : [ {
"name" : "activeConnections","metric_type" : "gauge","units" : "number of active connections","data_type" : "int","polling_frequency" : 10,"regex" : "Active connections: ([0-9]+)" },
{
"name" : "reading","metric_type" : "gauge","units" : "number of reading connections","data_type" : "int","polling_frequency" : 10,"regex" : "Reading: ([0-9]+) .*" },
{
"name" : "writing","metric_type" : "gauge","data_type" : "int","units" : "number of writing connections","polling_frequency" : 10,"regex" : ".*Writing: ([0-9]+).*" },
{
"name" : "waiting","metric_type" : "gauge","units" : "number of waiting connections","data_type" : "int","polling_frequency" : 10,"regex" : ".*Waiting: ([0-9]+)" }
]
}
当前cAdvisor只支持http接口方式,也就是被监控容器应用必须提供http接口,所以能力较弱,如果我们在collector这一层做扩展增强,提供数据库,mq等等标准应用的监控模式是很有价值的。在此之前的另一种方案就是如上图所示搭配promethuese(其内置有非常丰富的标准应用的插件涵盖了APM所需的采集大部分插件),但是这往往会导致系统更复杂(如果应用层并非想使用promethuse)
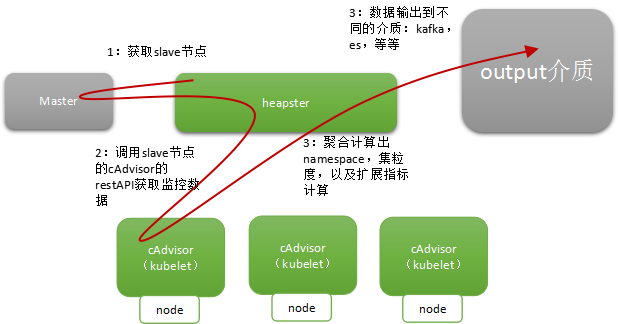
在Kubernetes监控生态中,一般是如下的搭配使用:
|
|
|
 QQ群⑧:
QQ群⑧:


 窥视卡
窥视卡 雷达卡
雷达卡 发表于 2018-1-4 18:18:29
 提升卡
提升卡 置顶卡
置顶卡 沉默卡
沉默卡 喧嚣卡
喧嚣卡 变色卡
变色卡 千斤顶
千斤顶 显身卡
显身卡