|
|
The wait is finally over. This is a huge update to the Azure Management Pack over the one that was released a couple of years ago, which not only monitors Azure applications but storage and virtual machines as well. You can download the new management pack from http://www.microsoft.com/en-us/download/details.aspx?id=38414. Remember that the management pack is currently a preview, and also that it is compatible only with System Center Operations Manager (SCOM) SP1. Below is the functionality of the management pack from the documentation:
- Discovers Windows Azure Cloud services.
- Provides status of each role instance.
- Collects and monitors performance information per role instance.
- Collects and monitors Windows events per role instance
- Collects and monitors the .NET Framework trace messages from each role instance.
- Grooms performance, event, and the .NET Framework trace data from Windows Azure storage.
- Changes the number of role instances.
- Discovers Windows Azure Virtual Machines
- Provides status of each role instance of the Virtual Machine
- Discovers Windows Azure Storage
- Monitors availability and size of each Storage and optionally alerts
- Discover relationships between discovered Azure resources, to see which other resources a particular Azure resource uses. This information is then displayed in a topology dashboard
- Monitors management and cloud service certificates and alerts if the certificates are about to expire
- Includes a new Distributed Application template that lets you create distributed applications that span Azure as well as on-premise resources, for Hybrid monitoring scenarios.
- Includes a set of dashboards for the Hybrid monitoring scenarios
In this post, I will provide a quick walkthrough of my experience getting the new management pack up and running. It is impressive, and the product group has promised improvements going forward. So let’s get started.
After you download the management pack install, which is a .msi file, you will have to run it so it can extract the two management packs, and write them to your file system. Note that the extensions are .mpb and not .mp, and thus are only compatible with SCOM 2012. Recall that management packs have historically been single XML files either in an .xml format or in a binary format with a .mp extension. The new format, which can consist of multiple XML files has a .mpb extension which means “management pack bundle.” Note the path to the management packs which you will need when you import the management packs into SCOM 2012, as seen below.

Launch the SCOM 2012 Operations Console and select the Administration view. Navigate to the Management Packs node and select the Import Management Packs item from the popup menu, as seen below.

You will now see the Import Management Packs dialog. Select the Add button, which will drop down two selections. Choose the Add from disk… option, as seen below. When you are prompted to search the online catalog, then select the No button.

Locate the management pack bundles and select both, as seen below.

Now go ahead and click the Install button that will start the import process, as seen below.

Once the import is done for the two management packs, click the Close button.

In the Search box at the top of the management pack list, enter “azure” and select the Find Now button. It may take a couple of minutes but you should eventually see two management packs:
- Microsoft.SystemCenter.WindowsAzure.Dashboard
- Windows Azure
Verify that the management packs are there, as seen below.

In the old management pack, you head straight to the monitoring wizard, but the new and improved pack works on a subscription boundary so it can discover all of the Azure resources that exist in the subscription. Still, you must select from the available resources the specific resources that you want to monitor. Let’s navigate to the bottom of the Administration explorer view and locate the Windows Azure node. Select the Add subscriptionlink, as seen below.

You will now be presented with a wizard to configure your Azure subscription. Supply the Subscription GUID, the private key of the management certificate that you have uploaded to the management portal, and the certificate password. I’m presuming you have already installed the private key in your Personal and Trusted Root Certification Authorities certificate stores. If not, please see the instructions in my previous post for SCOM 2007 here. The instructions are pretty much identical, and you will also need to follow the procedure to setup your Run Asaccounts.

In the next page, you will choose the Proxy Agent, which will be this SCOM server. Select the Browse… button, which will launch the Search dialog.

In the Search dialog, select the Search button, and then select your server in the Available items results list. Click the OK button when you’re done.

Now back at the Proxy Agent page, select the Add subscription button.

You will see a warning dialog, as seen below. Allow Operations Manager to distribute the accounts by selecting theYes button. In this case, the accounts will be distributed to the SCOM server.

You’re now done and can select the Finish button.

Now you’re back at the Windows Azure configuration page, as seen below. We’re all set now to see what SCOM has discovered in your subscription.

Select the Monitoring view in the lower left-hand corner, and then navigate to the Discovered Cloud Servicesnode in the Azure Resource Inventory folder. Your discovered cloud services view should look similar to below. Note that you will have to wait a few minutes for discovery to take place for your subscription. All items in the list will have a “Not monitored” state, which is what we should expect since we have to specifically select what we want to be monitored amongst the resources that have been discovered by SCOM. That is a very nice touch with the new management pack because from the beginning it is conserving resources, allowing you to select what youdesire to actively monitor.

Now before we can select what we will monitor, we need to create our own management pack to store information on the resources we decide to monitor. Return to the Administration view, navigate to theManagement Packs node and right-click on the node. Select the Create Management Pack item from the popup menu, as seen below.

In the Create a Management Pack wizard, specify the name of your management pack, and provide a version number if so desired, as seen below. Select the Next button.

On the next page of the wizard, select the Create button. Your management pack will now be created.

After a couple of minutes, verify your management pack has been added to the list, as seen below.

Now we can begin monitoring specific resources in your subscription. Select the Authoring view, and navigate to the Windows Azure Monitoring node. Right-click on the node and select the Add Monitoring Wizard… item from the popup menu, as seen below.

In the Add Monitoring Wizard, select Windows Azure Monitoring as the monitoring type (yes, it is redundant because that is the very reason you right-clicked on the explorer node previously), and select the Next button.

On the General Properties page, note that this is different from the SCOM 2007 R2 management pack. This does not map to a specific cloud service, but can be a combination of things you want to monitor with this particular management pack object. It could be any collection of cloud services, virtual machines, or storage, and can be in any combination of staging or production slots. So provide a name appropriate to what you would like to monitor in this monitoring object. Also, select the management pack you created since you will be putting all of your management objects in your own management pack and not the sealed Windows Azure management pack. When you’re done, select the Next button.

On the next Subscription page, select your subscription you previously configured, as seen below. Select the Nextbutton.

On the Cloud Services page, select the Add button to add your desired cloud services that you want to monitor in this subscription. You will be presented with a Search page.

Run the search based on the desired criteria. From the available services list, add each to the lower selected services list, as seen below. Select the OK button.

You’re now back to the Cloud Services page, where you will see the cloud services you selected. Select the Nextbutton.

On the Virtual machines page, you can now select the IaaS Virtual Machines that you have created in your subscription. In the same manner as you selected the cloud services, select your virtual machines.

When you’re done, you will be back to the Virtual machines page. Select the Next button to continue.

You will now be on the Storage page. In the same manner as you selected cloud services, select the Azure Storage that you would like to monitor. When you’re done, select the Next button.

Finally, you are brought to the Summary page where you can review the objects you have selected for monitoring in your subscription, as seen below. Select the Create button to proceed.

You will subsequently see your new monitoring object has been created, as seen below.

Let’s now return to the Monitoring view. Navigate to the Cloud Service State node under the Monitored Azure Resources folder. You will see here the cloud services you have selected for monitoring. Note that we came here instead of the Discovered Cloud Services node because this node is in the folder that only presents the monitored Azure resources we previously selected. The Discovered Cloud Services will simply display everything that has been discovered.

If we head back to the Discovered Cloud Services node, we will see all of the discovered cloud services. Note that just as above, I have three cloud services that are now being monitored, but two have a critical state. Let’s investigate the cause of the critical state.

Right-click on one of the critical state items, select Open in the popup menu, and then select Health Explorer for in the secondary popup menu.

You will now see the Health Explorer, which can provide specific details regarding where you may have problems with a given object you are monitoring. By default, the view is scoped to unhealthy child monitors (note the scoping in the yellow section immediately above the Health Explorer nodes), and we can see at the bottom of the explorer that it has found my expired certificate which caused it to go into a critical state soon after the object was first monitored.

If I go ahead and delete the scope to unhealthy child monitors by selecting the “x” next to “Scope is only unhealthy child monitors,” we find even more information on the cloud service, as seen below. Let’s go ahead and close the Health Explorer and go back to the Operations Console (this is a separate window, so closing it won’t close the Operations Console).

Another way to find out the problem is to check the alerts. Let’s navigate to the Active Alerts node under theWindows Azure folder, as seen below. Notice that the alert tells us the service certificate for this hosted (cloud) service will expire soon. This is a great new feature of the SCOM 2012 SP1 Azure management pack! All I have to do is update the service certificate and my cloud service state will turn back to green. Impressive!

Let’s now navigate to the Storage State node under the Monitored Azure Resources folder. Note that we have a healthy storage account.

Finally, let’s navigate to the Virtual Machine State node under the Monitored Azure Resources folder. Note that we are monitoring healthy virtual machines. One thing to note here is that the management pack does not look at any resources running on the virtual machines such as SQL Server or IIS. This is purely for the overall health of the server itself, and not any installed features or server programs running on the server. If you want that functionality, you will have add these servers to a Virtual Network so that you have IP-level connectivity and can monitor them just as you would an on-premises server. That would also mean adding the appropriate service packs for programs you would like to monitor such as SQL Server 2008/2012 or IIS.

Let’s now go to the Health Explorer for one of the virtual machines, and clear the scope for only unhealthy child monitors. When we expand the Performance node, notice that there are two performance counter monitors. Unfortunately, this is a bug and these monitors should not have been enabled. I know, what a disappointment and I have no idea what it actually is monitoring but I’m trying to find out and will report back when I do. What isworking here is the Availability monitor, even though the Performance monitors are not.

It’s not like this can’t be done because MetricsHub (an Azure-based Azure application monitoring and cost-optimization solution recently acquired by Microsoft) does it by providing an agent that you have to manually install on the virtual machine. The agent provides a secure, encrypted public service endpoint that allows MetricsHub to read the performance counters, displaying CPU, Network (Received/Sent), Memory, and Disk (Free Space/Read/Write) performance counters by default in its portal. SCOM can already distribute its own agent to on-premises servers, and to virtual machines that participate in an Azure virtual network and have a VPN connection established. The VPN connection established from on-premises to a virtual network makes IP-level connectivity to servers in the virtual network seamless. So there is no reason SCOM can’t adopt the same model as MetricsHub for virtual machines that don’t participate in a virtual network coupled with VPN. Until SCOM provides this functionality by providing an agent and updating the management pack to call the agent, you may want to take a look at MetricsHub to augment your monitoring of Azure applications and virtual machines. Out of the box, MetricsHub can display the following counters (the bold ones map to those mentioned above):
- LogicalDisk\% Free Space
- LogicalDisk\Disk Read Bytes/Sec
- LogicalDisk\Disk Write Bytes/Sec
- Memory\% Physical Memory
- NetworkInterface\Bytes Received/sec
- NetworkInterface\Bytes Sent/sec
- Process\% Processor Time
- Process\IO Read Bytes/sec
- Process\IO Write Bytes/sec
- Process\Working Set – Private
- Processor\% Processor Time
I won’t walk through the setup of MetricsHub because it is pretty easy to setup. You will have to go the Windows Azure Store in the management portal to add it, and the best thing is it is currently free. Below in the MetricsHub portal you see a virtual machine that has not yet been configured for monitoring by MetricsHub. You can select the link to download the Agent that must be installed on the virtual machine, as seen below.

After you click the button to install the Agent, you will be provided with instructions to download the MetricsHub Agent and get it installed on your virtual machine, as seen below.

About 30 minutes after installing the Agent, voila! You now have actual, working performance counters for your virtual machine. Some of these performance counters are the same as those presented in the Azure management portal, but you get those and even more from MetricsHub.

If you want to add additional counters to the display, select the Create Chart… button on the same page and you will be presented with a dialog that allows you to select the other available out-of-box performance counters.

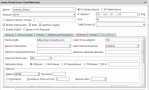
If you want to add additional counters, there is a configuration file namedMetricsHub.Diagnostics.Monitor.exe.config provided with the agent that has all of the out-of-box counters, so you can use these as templates to add any valid performance counters you wish. Below is a screen shot of section in the configuration file for setting up performance counters.

That ends our walkthrough for now, but we will be looking into finding more information on the new management pack. Stay tuned for much more to come on SCOM 2012 SP1 and Azure. We’re just getting started!
SCOM, Windows Azure, Operations Console, System Center Operations Manager 2012 SP1, SCOM 2012 SP1,Management Pack, SCOM Monitoring, MetricsHub, MetricsHub Agent |
|
 QQ群⑧:
QQ群⑧:


 窥视卡
窥视卡 雷达卡
雷达卡 发表于 2015-5-2 13:27:04
 提升卡
提升卡 置顶卡
置顶卡 沉默卡
沉默卡 喧嚣卡
喧嚣卡 变色卡
变色卡 千斤顶
千斤顶 显身卡
显身卡