Benchmarking: GET http://www.bbs.linuxblind.com/index.html
500 clients, running 60 sec.
Speed=495622 pages/min, 2788085 bytes/sec.
Requests: 495167 susceed, 455 failed.
-----------------------------------------------------------------------------------------
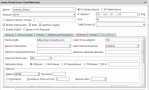
[root@localhost ~]# /usr/local/squid/bin/squidclient -h 192.168.1.108 -p 80 mgr:info
HTTP/1.1 200 OK
Server: squid/3.3.8
Mime-Version: 1.0
Date: Wed, 21 Aug 2013 08:28:44 GMT
Content-Type: text/plain
Expires: Wed, 21 Aug 2013 08:28:44 GMT
Last-Modified: Wed, 21 Aug 2013 08:28:44 GMT
X-Cache: MISS from linuxblind
X-Cache-Lookup: MISS from linuxblind:80
Via: 1.1 linuxblind (squid/3.3.8)
Connection: close
Squid Object Cache: Version 3.3.8
Start Time: Wed, 21 Aug 2013 08:25:16 GMT
Current Time: Wed, 21 Aug 2013 08:28:44 GMT
Connection information for squid:
Number of clients accessing cache: 2
Number of HTTP requests received: 495341
Number of ICP messages received: 0
Number of ICP messages sent: 0
Number of queued ICP replies: 0
Number of HTCP messages received: 0
Number of HTCP messages sent: 0
Request failure ratio: 0.00
Average HTTP requests per minute since start: 142850.5
Average ICP messages per minute since start: 0.0
Select loop called: 610212 times, 0.341 ms avg
Cache information for squid:
Hits as % of all requests: 5min: 100.0%, 60min: 100.0%
Hits as % of bytes sent: 5min: 100.0%, 60min: 100.0%
Memory hits as % of hit requests: 5min: 100.0%, 60min: 100.0%
Disk hits as % of hit requests: 5min: 0.0%, 60min: 0.0%
Storage Swap size: 4220 KB
Storage Swap capacity: 0.4% used, 99.6% free
Storage Mem size: 224 KB
Storage Mem capacity: 0.1% used, 99.9% free
Mean Object Size: 26.38 KB
Requests given to unlinkd: 0
Median Service Times (seconds) 5 min 60 min:
HTTP Requests (All): 0.00000 0.00000
Cache Misses: 0.00000 0.00000
Cache Hits: 0.00000 0.00000
Near Hits: 0.00000 0.00000
Not-Modified Replies: 0.00000 0.00000
DNS Lookups: 0.00000 0.00000
ICP Queries: 0.00000 0.00000
Resource usage for squid:
UP Time: 208.053 seconds
CPU Time: 60.177 seconds
CPU Usage: 28.92%
CPU Usage, 5 minute avg: 33.42%
CPU Usage, 60 minute avg: 33.42%
Process Data Segment Size via sbrk(): 4492 KB
Maximum Resident Size: 50624 KB
Page faults with physical i/o: 0
Memory usage for squid via mallinfo():
Total space in arena: 4624 KB
Ordinary blocks: 4500 KB 179 blks
Small blocks: 0 KB 0 blks
Holding blocks: 10916 KB 5 blks
Free Small blocks: 0 KB
Free Ordinary blocks: 124 KB
Total in use: 124 KB 1%
Total free: 124 KB 1%
Total size: 15540 KB
Memory accounted for:
Total accounted: 942 KB 6%
memPool accounted: 942 KB 6%
memPool unaccounted: 14598 KB 94%
memPoolAlloc calls: 40123090
memPoolFree calls: 40124835
File descriptor usage for squid:
Maximum number of file descriptors: 20480
Largest file desc currently in use: 60
Number of file desc currently in use: 26
Files queued for open: 0
Available number of file descriptors: 20454
Reserved number of file descriptors: 100
Store Disk files open: 0
Internal Data Structures:
213 StoreEntries
54 StoreEntries with MemObjects
53 Hot Object Cache Items
160 on-disk objects
 QQ群⑧:
QQ群⑧:


 窥视卡
窥视卡 雷达卡
雷达卡 发表于 2018-12-27 13:36:48

 提升卡
提升卡 置顶卡
置顶卡 沉默卡
沉默卡 喧嚣卡
喧嚣卡 变色卡
变色卡 千斤顶
千斤顶 显身卡
显身卡