|
|
使用PHP画统计图的方法
第一种方法


<?php
//最后一次修改:2004-6-21
//一个生成矩形图,曲线图的图形分析类
//作者:tonera
//说明:
//任何人可在任何场合自由使用这个类。但由此所发生的损害跟作者无关。
//可根据数据自适应X和Y轴大小。
//在同一个图形中可显示多个曲线图
//用户可给出生成的图的尺寸大小,数据参数。类根据数据的值来判断生成的图形的高(默认10格)和宽各分几格。
//若用户没有给出图的尺寸大小,则图形高和宽为255像素
//数据参数通过一个方法add_data($array)来多次添加,每次一个数组。
//可自设定图形边框,矩形图内线,深色边框线,浅色边框线,曲线,点的颜色。若用户没有指定,则为默认值
//set_colors方法设定不同曲线的不同色彩
//可进行图形的叠加显示:点,线,矩形
//注意:需要GD库支持
/*
//使用示例
$gg=new build_graph();
$d1=array(0,62,25,20,20,100,99);
$d2=array(0,80,75,65,100,56,79);
$d3=array(0,60,50,25,12,56,45);
$gg->add_data($d1);
$gg->add_data($d2);
$gg->add_data($d3);
$gg->set_colors("ee00ff,dd8800,00ff00");
//生成曲线图
$gg->build("line",0); //参数0表示显示所有曲线,1为显示第一条,依次类推
//生成矩形图
//$gg->build("rectangle","2"); //参数0表示显示第一个矩形,1也为显示第一条,其余依次类推
*/
class build_graph {
var $graphwidth = 300;
var $graphheight = 300;
var $width_num = 0; //宽分多少等分
var $height_num = 10; //高分多少等分,默认为10
var $height_var = 0; //高度增量(用户数据平均数)
var $width_var=0; //宽度增量(用户数据平均数)
var $height_max=0; //最大数据值
var $array_data=array(); //用户待分析的数据的二维数组
var $array_error=array(); //收集错误信息
var $colorBg=array(255,255,255); //图形背景-白色
var $colorGrey=array(192,192,192); //灰色画框
var $colorBlue=array(0,0,255); //蓝色
var $colorRed=array(255,0,0); //红色(点)
var $colorDarkBlue=array(0,0,255); //深色
var $colorLightBlue=array(200,200,255); //浅色
var $colorLightBlack = array(138,138,120); //浅黑
var $colorBlack = array(30,30,30); //黑
var $rgbArray = array("ee00ff","dd8800","00ff00","104E8B");
var $array_color; //曲线着色(存储十六进制数)
var $image; //我们的图像
var $lineType = ''; //画底线时标的数字值,则x的值,范围为'day', 'hour'两值
var $beginDay = '';
//方法:接受用户数据
function add_data($array_user_data, $dataKey = 0){
if(!is_array($array_user_data)){
$array_user_data = array();
}
if(!is_array($array_user_data) or empty($array_user_data)){
$this->array_error['add_data']="没有可供分析的数据";
return false;
exit();
}
if($dataKey == 0 || array_key_exists($dataKey, $this->array_data)){
$dataKey = count($this->array_data);
}
$this->array_data[$dataKey] = $array_user_data;
}
//方法:定义画布宽和长
function set_img($img_width,$img_height){
$this->graphwidth = $img_width;
$this->graphheight = $img_height;
}
//设定Y轴的增量等分,默认为10份
function set_height_num($var_y){
$this->height_num=$var_y;
}
//定义各图形各部分色彩
function get_RGB($color){ //得到十进制色彩
$R=($color>>16) & 0xff;
$G=($color>>8) & 0xff;
$B=($color) & 0xff;
return (array($R,$G,$B));
}
//---------------------------------------------------------------
#定义背景色
function set_color_bg($c1,$c2,$c3){
$this->colorBg=array($c1,$c2,$c3);
}
#定义画框色
function set_color_Grey($c1,$c2,$c3){
$this->colorGrey=array($c1,$c2,$c3);
}
#定义蓝色
function set_color_Blue($c1,$c2,$c3){
$this->colorBlue=array($c1,$c2,$c3);
}
#定义色Red
function set_color_Red($c1,$c2,$c3){
$this->colorRed=array($c1,$c2,$c3);
}
#定义深色
function set_color_DarkBlue($c1,$c2,$c3){
$this->colorDarkBlue=array($c1,$c2,$c3);
}
#定义浅色
function set_color_LightBlue($c1,$c2,$c3){
$this->colorLightBlue=array($c1,$c2,$c3);
}
//设定画底线时标的数字值,则x的值,范围为'day', 'hour'两值
function setLineStrinType($type){
if(!in_array($type, array('day', 'hour'))){
return false;
}
$this->lineType = $type;
}
//---------------------------------------------------------------
//方法:由用户数据将画布分成若干等份宽
//并计算出每份多少像素
function get_width_num(){
$dataCount = array();
foreach ($this->array_data as $key => $oneData){
$dataCount[] = count($oneData);
}
$this->width_num = max($dataCount);
}
function get_max_height(){
//获得用户数据的最大值
$tmpvar = array();
foreach($this->array_data as $tmp_value){
$tmpvar[]= max($tmp_value);
}
if(isset($tmpvar[0])){
$more = $tmpvar[0];
}
$this->height_max = max($tmpvar) + $this->height_var;
return max($tmpvar);
}
function get_height_length(){
//计算出每格的增量长度(用户数据,而不是图形的像素值)
$max_var = $this->get_max_height();
$max_var = round($max_var/$this->height_num);
$first_num = substr($max_var,0,1);
if(substr($max_var,1,1)){
if(substr($max_var,1,1)>=5)
$first_num += 1;
}
for($i = 1; $i < strlen($max_var); $i++){
$first_num .= "0";
}
return (int)$first_num;
}
function get_var_wh(){ //得到高和宽的增量
$this->get_width_num();
//得到高度增量和宽度增量
$this->height_var = $this->get_height_length();
$this->width_var = round($this->graphwidth/$this->width_num, 3);
}
function set_colors($str_colors){
//用于多条曲线的不同着色,如$str_colors="ee00ff,dd0000,cccccc"
$this->array_color = split(",",$str_colors);
}
function set_begin_day($beginDay){
if(!is_numeric($beginDay)){
return false;
}
$this->beginDay = $beginDay;
}
######################################################################################################
function build_line($var_num){
if(!empty($var_num)){ //如果用户只选择显示一条曲线
$array_tmp[0] = $this->array_data[$var_num-1];
$this->array_data = $array_tmp;
}
for($j=0;$j<count($this->array_data);$j++){
list($R,$G,$B)=$this->get_RGB(hexdec($this->array_color[$j]));
$colorBlue=imagecolorallocate($this->image,$R,$G,$B);
for($i = 0;$i < $this->width_num - 1;$i++){
$height_pix = round(($this->array_data[$j][$i]/$this->height_max)*$this->graphheight);
$height_next_pix = round($this->array_data[$j][$i + 1]/$this->height_max*$this->graphheight);
imageline($this->image,$this->width_var*($i + 1),$this->graphheight-$height_pix,$this->width_var*($i + 2),$this->graphheight-$height_next_pix,$colorBlue);
}
}
//画点
$colorRed = imagecolorallocate($this->image, $this->colorBlue[0], $this->colorBlue[1], $this->colorBlue[2]);
for($j = 0; $j < count($this->array_data); $j++){
list($R,$G,$B) = $this->get_RGB(hexdec($this->array_color[$j]));
$colorPoint = imagecolorallocate($this->image,$R,$G,$B);
for($i = 0; $i < $this->width_num; $i++){
if(isset($this->array_data[$j][$i])){
$height_pix = round(($this->array_data[$j][$i]/$this->height_max)*$this->graphheight);
$arcRet = imagearc($this->image,$this->width_var*($i + 1),$this->graphheight-$height_pix,6,5,0,360,$colorPoint);
$borderRet = imagefilltoborder($this->image,$this->width_var*($i + 1),$this->graphheight-$height_pix,$colorPoint,$colorPoint);
if(!$arcRet || !$borderRet){
break;
}
}
}
}
for($j = 0; $j < count($this->array_data); $j++){
list($R,$G,$B) = $this->get_RGB(hexdec($this->array_color[$j]));
$colorPoint = imagecolorallocate($this->image,$R,$G,$B);
for($i = 0; $i < $this->width_num; $i++){
$height_pix = round(($this->array_data[$j][$i]/$this->height_max) * $this->graphheight);
$arcRet = imagearc($this->image,$this->width_var*($i + 1),$this->graphheight-$height_pix,6,5,0,360,$colorPoint);
$arcRet = imagefilltoborder($this->image,$this->width_var*($i + 1),$this->graphheight-$height_pix,$colorPoint,$colorPoint);
if(!$arcRet || !$borderRet){
break;
}
}
}
}
######################################################################################################
function build_rectangle($select_gra){
if(!empty($select_gra)){ //用户选择显示一个矩形
$select_gra-=1;
}
//画矩形
//配色
$colorDarkBlue=imagecolorallocate($this->image, $this->colorDarkBlue[0], $this->colorDarkBlue[1], $this->colorDarkBlue[2]);
$colorLightBlue=imagecolorallocate($this->image, $this->colorLightBlue[0], $this->colorLightBlue[1], $this->colorLightBlue[2]);
if(empty($select_gra))
$select_gra=0;
for($i=0; $i<$this->width_num; $i++){
$height_pix=round(($this->array_data[$select_gra][$i]/$this->height_max)*$this->graphheight);
imagefilledrectangle($this->image,$this->width_var*$i,$this->graphheight-$height_pix,$this->width_var*($i+1),$this->graphheight, $colorDarkBlue);
imagefilledrectangle($this->image,($i*$this->width_var)+1,($this->graphheight-$height_pix)+1,$this->width_var*($i+1)-5,$this->graphheight-2, $colorLightBlue);
}
}
######################################################################################################
function create_cloths(){
//创建画布
$this->image = imagecreate($this->graphwidth+20,$this->graphheight+20);
}
function create_frame(){
//创建画框
$this->get_var_wh();
//配色
$colorBg=imagecolorallocate($this->image, $this->colorBg[0], $this->colorBg[1], $this->colorBg[2]);
$colorGrey=imagecolorallocate($this->image, $this->colorGrey[0], $this->colorGrey[1], $this->colorGrey[2]);
//创建图像周围的框
imageline($this->image, 0, 0, 0, $this->graphheight,$colorGrey);
imageline($this->image, 0, 0, $this->graphwidth, 0,$colorGrey);
//imageline($this->image, ($this->graphwidth-1),0,($this->graphwidth-1),($this->graphheight-1),$colorGrey);
imageline($this->image, 0,($this->graphheight-1),($this->graphwidth-1),($this->graphheight-1),$colorGrey);
}
function create_line(){
//创建网格。
$this->get_var_wh();
$colorBg = imagecolorallocate($this->image, $this->colorBg[0], $this->colorBg[1], $this->colorBg[2]);
$colorGrey = imagecolorallocate($this->image, $this->colorGrey[0], $this->colorGrey[1], $this->colorGrey[2]);
$colorRed = imagecolorallocate($this->image, $this->colorRed[0], $this->colorRed[1], $this->colorRed[2]);
$colorLightBlack = imagecolorallocate($this->image, $this->colorLightBlack[0], $this->colorLightBlack[1], $this->colorLightBlack[2]);
$colorBlack = imagecolorallocate($this->image, $this->colorBlack[0], $this->colorBlack[1], $this->colorBlack[2]);
for($i = 1 ;$i <= $this->height_num + 5; $i++){
//画横线
imageline($this->image,0,$this->graphheight-($this->height_var/$this->height_max*$this->graphheight)*$i,$this->graphwidth,$this->graphheight-($this->height_var/$this->height_max*$this->graphheight)*$i,$colorGrey);
//标出数字
imagestring($this->image,2,0,$this->graphheight-($this->height_var/$this->height_max*$this->graphheight)*$i,$this->height_var*$i,$colorLightBlack);
}
$type = $this->lineType;
if($type == "day"){
if($this->beginDay){
$j = $this->beginDay;
}else{
$j = 1;
}
}elseif($type == "hour"){
$j = 0;
}
for($i = 1;$i <= $this->width_num; $i++){
//画竖线
imageline($this->image,$this->width_var*$i,0,$this->width_var*$i,$this->graphwidth,$colorGrey);
//标出数字
if($type == 'day'){
if($i == 1){
imagestring($this->image,2,$this->width_var*$i,$this->graphheight-15,$j,$colorBlack);
}
imagestring($this->image,2,$this->width_var*($i + 1),$this->graphheight-15,$j + 1,$colorBlack);
}elseif($type == 'hour'){
if($i == 1){
imagestring($this->image,2,$this->width_var*$i,$this->graphheight-15,$j,$colorBlack);
}
imagestring($this->image,2,$this->width_var*($i + 1),$this->graphheight-15,$j + 1,$colorBlack);
}else{
imagestring($this->image,2,$this->width_var*($i + 1),$this->graphheight-15,$i,$colorBlack);
}
$j++;
if($type == "day" && $j == 31){
$j = 1;
}elseif($type == "hour" && $j == 23){
$j = -1;
}
}
}
function build($graph,$str_var, $outpwd = ""){
//$graph是用户指定的图形种类,$str_var是生成哪个数据的图
if(empty($outpwd)){
header("Content-type: image/jpeg");
}
$this->create_cloths(); //先要有画布啊~~
switch ($graph){
case "line":
$this->create_frame(); //画个框先:)
$this->create_line(); //打上底格线
$this->build_line($str_var); //画曲线
break;
case "rectangle":
$this->create_frame(); //画个框先:)
$this->build_rectangle($str_var); //画矩形
$this->create_line(); //打上底格线
break;
}
//输出图形并清除内存
if(!empty($outpwd)){
imagepng($this->image, $outpwd);
}else{
imagepng($this->image);
}
imagedestroy($this->image);
}
######################################################################################################
}
View Code
第二种是用开源工具jpgraph,参见 http://jpgraph.net/features
Chart Gallery
Line / Area

- Line Plots
- Filled Line Plots
- Step Line Plots
- Line Plots With Markers
- Line Plots With Inverted Y-axis
- Line Plots With Values
Bar

- Standard Bar plots
- Horizontal Bar plots
- Adding backgrounds and patterns to bar plots
- Combined Line and Bar plots
Pie

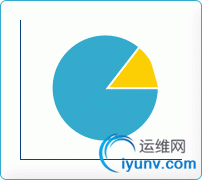
- Pie Plots
- 3D Pie plots
- Exploding Pie plots
Scatter

Impluse

Field

Splines

Geo Maps

Stock

Polar

Error

Balloon

Radar

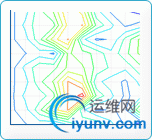
Contour

Others(Pro ver.)

General features
Below is a number of "one-liners" that describe some of the general features available in JpGraph.
- Anti-aliasing for Pie charts.
- More advanced formatting of graph titles including 3D Bevel effects.
- Additional 3D Bevel formatting feature for the entire Graph
- Gradient fills for bars are now also displayed in the legend
- Improvements on legend formatting. It is now possible to have several columns in the legend
- Improved callback capability for Plot marks. The new callbacks will provide both X and Y coordinates.
- Footer text can now be used on all graph types
- dded possibility to use the Freely available Vera TTF fonts. These fonts are available from http://www.gnome.org/fonts/
- Built in rotation of graphs
- Fine tuning of legend layout, size and positioning of individual legends and markers.
- Added possibility to use object methods as callbacks and not only static global functions
- Full support for color alpha blending
- Automatic generation of client side image maps to make it possible to generate drill-down graphs.
- Advanced interpolation with cubic splines to get smooth curves from just a few data points.
- Several different fill styles for line plots
- Advanced image 3D effects built-in without external image manipulation programs
- Supports unlimited number of plots in each graph, makes it easy to compose complex graph which consists of several plot types
- Additional built-in images for plot marks including 3D rendered markers like diamonds, squares, bevels, balls, pins etc
- Text strings can now be added to the plot using scale coordinates
- Support for all primitive URL parameter types with CSIM graphs.
- Autoscaling will now also consider added lines and texts.
- Hare/Niemeyer Integer compensation for Pie Plots
- Added the possibility to use Vertical Gradient fill for line plots.
- Improved error handling. The visual appearance of the error handling now tries to mimic any windows system window (in graphic)
- Builtin support to display over 200 country flag and the possibility to use them as icons or markers in the graphs. All the flag images are builtin with JpGraph in an efficient pre-compiled data format.
- Supports caching (with timeout) of generated graphs to lessen burden of a HTTP server.
- Intelligent autoscaling which gravitates towards aesthetical values.
- Fully supports manual scaling, with fine grain control of position of ticks
- Supports color-gradient fill for bar graphs
- Supports both vertical and horizontal grids (with image depth specification)
- Supports both on-the fly image generation and batch processing.
- Extensive documentation
- Advanced text formatting using TTF fonts
- Support for both Chinese and Japanes character sets
非常多的例子,很好的。
第三种用 open flash chart,参见
http://teethgrinder.co.uk/open-flash-chart/gallery-data.php
http://www.helloweba.com/view-blog-41.html
http://www.phphi.cn/post/98/
http://blogold.chinaunix.net/u3/105169/showart_2322209.html
http://hi.baidu.com/duwuzhe722/blog/item/e11b2d2662b512038b82a175.html
第四种使用amcharts,参见http://www.amcharts.com |
|