|
|
Preface
ZABBIX was a small Internet Co [color=#1B8EDE!important]server
performance monitor is the first choice, free, secondly, there is a special company and [color=#1B8EDE!important]community
development and maintenance, so that the stability and function in continuously strengthen and improve. ZABBIX has a UI interface and grouping [color=#1B8EDE!important]strategies in
detail, agent is installed in the monitored server, without adding any control options, because ZABBIX comes with some necessary monitoring, such as agent.ping, ZABBIX drawing, this is dedicated to boss see, very important. It also supports user-defined control
options, which is very convenient, I want [color=#1B8EDE!important]to
say today is the disk monitoring, dynamic monitoring of the title, number recognition disk means intelligence, and generate the corresponding monitoring options, because each server disk may not be the same, so I was using ZABBIX discovery method.
Personally think that the UI interface is more complex, but after all, the more complex is the high-end. I used not options for all configure and administration tag (this is necessary), also graphs and screen, these two options are in [color=#1B8EDE!important]the
monitor tag, and BOSS were most concerned about.
Automatically find the disk
In the final analysis, automatic judgment all artificially set all possibilities, then according to the actual situation to choose from, there are a lot of methods, see you specific requirements. Here, I want to disk monitoring, we should first find out what
disk, here the use of shell scripts. Because the ZABBIX discovery requires a fixed format, which can be reference here, the bottom part.
Scripts are as follows:
1 #!/bin/bash
2 #written by lenwood
3 #mail:
4 diskarray=(`cat /proc/diskstats |grep -E "\bsd[abcdefg]\b|\bxvd[abcdefg]\b"|grep -i "\b$1\b"|awk '{print $3}'|sort|uniq 2>/dev/null`)
5 length=${#diskarray[@]}
6 printf "{\n"
7 printf '\t'"\"data\":["
8 for ((i=0;i<$length;i++))
9 do
10 printf '\n\t\t{'
11 printf "\"{#DISK_NAME}\":\"${diskarray[$i]}\"}"
12 if [ $i -lt $[$length-1] ];then
13 printf ','
14 fi
15 done
16 printf "\n\t]\n"
17 printf "}\n"
As above, here by reading the /proc/diskstats, select one of the disk, according to the actual situation, here I will find similar to SDA or xvda, because we are using a SATA interface hard disk and part of [color=#1B8EDE!important]the
cloud server.
The script out similar results as follows
1 {
2 "data":[
3 {"{#DISK_NAME}":"sda"}
4 {"{#DISK_NAME}":"sdb"}
5 ]
6 }
Then use the ZABBIX to run the script, so it will be written to zabbix_agentd.conf in, as follows
UserParameter=io.scandisk
,/infra/zabbix/os/disk_scan.sh $1
The iostat command
For disk monitoring I use the iostat command, because it can give detailed information on disk, such as sector[color=#1B8EDE!important]literacy,
IO queue length, iowait, svctime etc.
The following command:
1 nohup iostat -m -x -d 30 >/tmp/iostat_output &
By tail -f /tmp/iostat_output, iostat command available disk information collection, results similar to the following
Device: rrqm/s wrqm/s r/s w/s rMB/s wMB/s avgrq-sz avgqu-sz await svctm %util
hda 0.00 0.20 0.00 7.43 0.00 0.16 43.28 0.23 30.80 2.43 1.81
hda1 0.00 0.20 0.00 7.43 0.00 0.16 43.28 0.23 30.80 2.43 1.81
hda2 0.00 0.00 0.00 0.00 0.00 0.00 0.00 0.00 0.00 0.00 0.00
xvdb 0.00 0.00 0.00 0.00 0.00 0.00 0.00 0.00 0.00 0.00 0.00
xvdb1 0.00 0.00 0.00 0.00 0.00 0.00 0.00 0.00 0.00 0.00 0.00
hdc 0.00 0.00 0.00 0.00 0.00 0.00 0.00 0.00 0.00 0.00 0.00
The detailed explanation of some parameters are as follows
rrqm/S: merge number of read operations per second. Delta(rmerge)/s
wrqm/S: per second [color=#1B8EDE!important]operation number and write merge. Delta(wmerge)/s
r/Read the I/O device s: completion times per second. Delta(rio)/s
w/S: finished writing I/O times per second. Delta(wio)/s
rsec/S: read the number of sectors per second. Delta(rsect)/s
wsec/S: write the number of sectors per second. Delta(wsect)/s
rkB/S: read K bytes per second. Is rsect/Half of the s, because each sector size of 512 bytes. ([color=#1B8EDE!important]calculated)
wkB/S: write K bytes per second. Is wsect/Half s. (calculated)
avgrqAverage -sz: per I/O device data size (sector). delta(rsect+wsect)/delta(rio+wio)
avgqu-sz: I/O average queue length. Delta(aveq)/s/1000 (because the aveq milliseconds).
Average await: per device I/The [color=#1B8EDE!important]waiting [color=#1B8EDE!important]time of O operation (MS). Delta(ruse+wuse)/delta(rio+wio)
Average svctm: per device I/The O operation business hours (MS). Delta(use)/delta(rio+wio)
%Util: a second what percentage of the time for the I/O operation, or a second time I/O queue is not empty. Delta(use)/s/1000 (because the use milliseconds)
Combined with ZABBIX
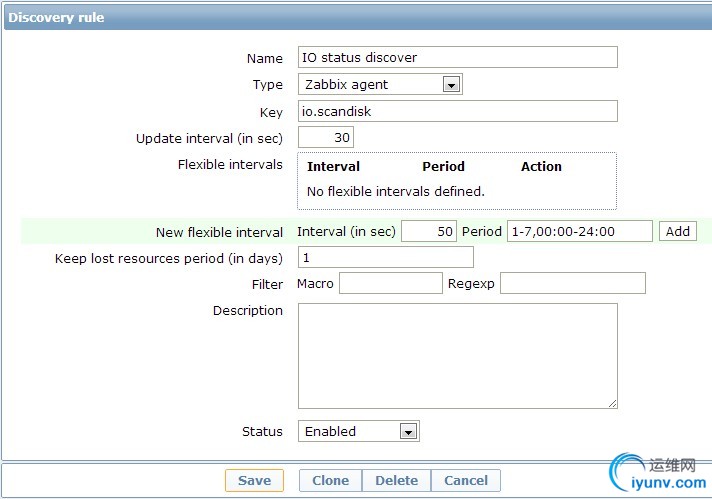
The beginning has been said, is the combination of ZABBIX discovery function, so to make the following settings on the ZABBIX.
(1)The new discovery rules

(2)After the new discovery rule, you can start writing item prototypes, here is an example of the avgqu-sz (the average length of I/O queue).

After the establishment of item, zabbix_agentd.conf to write the corresponding UserParameters, as follows.
1 UserParameter=io.scandisk
,/infra/zabbix/os/disk_scan.sh $1
2 UserParameter=io.rps
,/usr/bin/tail /tmp/iostat_output |grep "\b$1\b"|tail -1|awk '{print $$4}'
3 UserParameter=io.wps
,/usr/bin/tail /tmp/iostat_output |grep "\b$1\b" |tail -1|awk '{print $$5}'
4 UserParameter=io.rMBps
,/usr/bin/tail /tmp/iostat_output |grep "\b$1\b" |tail -1|awk '{print $$6}'
5 UserParameter=io.wMBps
,/usr/bin/tail /tmp/iostat_output |grep "\b$1\b" |tail -1|awk '{print $$7}'
6 UserParameter=io.avgrq-sz
,/usr/bin/tail /tmp/iostat_output |grep "\b$1\b" |tail -1|awk '{print $$8}'
7 UserParameter=io.avgqu-sz
,/usr/bin/tail /tmp/iostat_output |grep "\b$1\b" |tail -1|awk '{print $$9}'
8 UserParameter=io.await
,/usr/bin/tail /tmp/iostat_output |grep "\b$1\b" |tail -1|awk '{print $$10}'
9 UserParameter=io.svctm
,/usr/bin/tail /tmp/iostat_output |grep "\b$1\b" |tail -1|awk '{print $$11}'
10 UserParameter=io.util
,/usr/bin/tail /tmp/iostat_output |grep "\b$1\b" |tail -1|awk '{print $$12}'
Above, part of the actual monitoring has been completed. But also drawing, also is the new graph prototype, as shown below.

Finally, look at [color=#1B8EDE!important]the
work successfully, so as to realize the automatic determine the number of the disk on the server ZABBIX, and then automatically monitoring and generate graphs correspond to disk.

|
|