|
|
zabbix自带的有一个模板,我们可以借助于此模板监控mysql数据库!但是这个模板的item需要在被监控端定义。
zabbix所在服务器ip为:192.168.1.150
mysql所在服务器为:192.168.1.121
1
2
| [iyunv@slave ~]# mysqladmin -uroot -p123456 -hlocalhost status
Uptime: 23149 Threads: 1 Questions: 32 Slow queries: 0 Opens: 15 Flush tables: 1 Open tables: 8 Queries per second avg: 0.1
|
mysqladmin返回的一些命令参数,这些有我们需要的数据。
1
2
3
4
5
6
7
8
9
10
11
12
13
14
15
| [iyunv@slave ~]# mysqladmin -uroot -p123456 -hlocalhost extended-status
+-----------------------------------+----------+
| Variable_name | Value |
+-----------------------------------+----------+
| Aborted_clients | 0 |
| Aborted_connects | 6 |
| Binlog_cache_disk_use | 0 |
| Binlog_cache_use | 0 |
| Bytes_received | 2318 |
| Bytes_sent | 5582 |
| Com_admin_commands | 0 |
| Com_assign_to_keycache | 0 |
| Com_alter_db | 0 |
| Com_alter_db_upgrade | 0 |
| Com_alter_event | 0 |
|
这个命令返回的时mysql的一些变量和一些数值。
了解了这些,然后开始做监控!
在zabbix中有个Template App Mysql模板,我们要做的就是为这个模板创建item,然后把这个模板链接到mysql服务器所在的主机。
我们借助于UserParameter创建item。
首先写一个获取mysql数据信息的脚本:脚本是网上的,因此保留作者信息。需要更改的就是用户名和密码,以及mysql及mysqladmin命令的绝对路径。
脚本放在客户端。
1
2
3
4
5
6
7
8
9
10
11
12
13
14
15
16
17
18
19
20
21
22
23
24
25
26
27
28
29
30
31
32
33
34
35
36
37
38
39
40
41
42
43
44
45
46
47
48
49
50
51
52
53
54
55
56
57
58
59
60
61
62
63
64
65
66
67
68
69
70
71
72
73
74
75
76
77
78
79
80
81
82
83
84
85
86
87
88
89
| #!/bin/bash
# -------------------------------------------------------------------------------
# FileName: check_mysql.sh
# Revision: 1.0
# Date: 2015/06/09
# Author: DengYun
# Email: dengyun@ttlsa.com
# Website: www.ttlsa.com
# Description:
# Notes: ~
# -------------------------------------------------------------------------------
# Copyright: 2015 (c) DengYun
# License: GPL
# 用户名
MYSQL_USER='root'
# 密码
MYSQL_PWD='123456'
# 主机地址/IP
MYSQL_HOST='127.0.0.1'
# 端口
MYSQL_PORT='3306'
# 数据连接
MYSQL_CONN="/usr/local/mysql/bin/mysqladmin -u${MYSQL_USER} -p${MYSQL_PWD} -h${MYSQL_HOST} -P${MYSQL_PORT}"
# 参数是否正确
if [ $# -ne "1" ];then
echo "arg error!"
fi
# 获取数据
case $1 in
Uptime)
result=`${MYSQL_CONN} status|cut -f2 -d":"|cut -f1 -d"T"`
echo $result
;;
Com_update)
result=`${MYSQL_CONN} extended-status |grep -w "Com_update"|cut -d"|" -f3`
echo $result
;;
Slow_queries)
result=`${MYSQL_CONN} status |cut -f5 -d":"|cut -f1 -d"O"`
echo $result
;;
Com_select)
result=`${MYSQL_CONN} extended-status |grep -w "Com_select"|cut -d"|" -f3`
echo $result
;;
Com_rollback)
result=`${MYSQL_CONN} extended-status |grep -w "Com_rollback"|cut -d"|" -f3`
echo $result
;;
Questions)
result=`${MYSQL_CONN} status|cut -f4 -d":"|cut -f1 -d"S"`
echo $result
;;
Com_insert)
result=`${MYSQL_CONN} extended-status |grep -w "Com_insert"|cut -d"|" -f3`
echo $result
;;
Com_delete)
result=`${MYSQL_CONN} extended-status |grep -w "Com_delete"|cut -d"|" -f3`
echo $result
;;
Com_commit)
result=`${MYSQL_CONN} extended-status |grep -w "Com_commit"|cut -d"|" -f3`
echo $result
;;
Bytes_sent)
result=`${MYSQL_CONN} extended-status |grep -w "Bytes_sent" |cut -d"|" -f3`
echo $result
;;
Bytes_received)
result=`${MYSQL_CONN} extended-status |grep -w "Bytes_received" |cut -d"|" -f3`
echo $result
;;
Com_begin)
result=`${MYSQL_CONN} extended-status |grep -w "Com_begin"|cut -d"|" -f3`
echo $result
;;
*)
echo "Usage:$0(Uptime|Com_update|Slow_queries|Com_select|Com_rollback|Questions|Com_insert|Com_delete|Com_commit|Bytes_sent|Bytes_received|Com_begin)"
;;
esac
|
最后在客户端的/etc/zabbix_agentd.conf中最后加入以下内容:
1
2
3
| UserParameter=mysql.ping,/usr/local/mysql/bin/mysqladmin -uroot -p123456 ping |grep -c "alive"
UserParameter=mysql.version,/usr/local/mysql/bin/mysql -V
UserParameter=mysql.status,/bin/bash /usr/local/sbin/check_mysql.sh $1
|
第一条命令:检测mysql是否启动
第二条命令:显示mysql的版本号
第三条命令:得出我们要找的mysql基本信息。
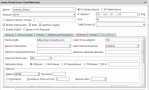
然后就是在zabbix客户端,在mysql所在的主机上链接mysql模板。
如下图所示:

 表示已经监控当前的mysql, 表示已经监控当前的mysql,
|
|
 QQ群⑧:
QQ群⑧:


 窥视卡
窥视卡 雷达卡
雷达卡 发表于 2017-1-13 16:15:06
 提升卡
提升卡 置顶卡
置顶卡 沉默卡
沉默卡 喧嚣卡
喧嚣卡 变色卡
变色卡 千斤顶
千斤顶 显身卡
显身卡