|
|
http://www.ilsistemista.net/index.php/virtualization/43-kvm-scalability-and-consolidation-ratio-cache-none-vs-cache-writeback.html?limitstart=0
In the latest ten years, full-virtualization technologies gained much traction. While this sometime led to an excessive virtual machines proliferation, the key concept is very appealing: as CPU performance and memory capacity relentless grow over time, why do not use this ever-increasing power to consolidate multiple operating system instances on one single, powerful server?
If done correctly (ie: without an unnecessary grow of total OS instances), this consolidation process bring considerable lower operating costs, both from electricity and maintenance/administration standpoints.
However, in order to extract good performance from virtual machines, it is imperative to correctly size the host virtualizer: CPU, disk, memory and network subsystems should all be capable to sustain the expected average workload, and also something more for the inevitable usage peeks.
Usually, the most stressed component in a virtualized environment is the I/O subsystem, especially taking into account the very slow random read/write speed offered by mechanical disks. As covered in previous articles, KVM give you the choice to enable OS caching on the image file or LVM volume backing a VM's virtual disk.
As latest Qemu versions honor write barrier requests and pass them down to the host stack, using a write-back strategy is a real option. Sure, it is not a silver bullet: there are some cases where a write-back cache could represent a problem, for example in scenario involving live-migration operation (currently, libvirt/qemu advise you to not use writeback cache during live migration, or data corruption may happens). However in many cases it is an appropriate choice.
So, go straight to the point: how KVM cache setting affect VMs performance, host resources usage and consolidation ratio? What we are looking for, and when using a cache is not appropriate
In this article we are going to evaluate if, and how much, different caching settings influence KVM performance at a point where consolidation ratio can be impacted. To answer this question, we will collect performance data from both guests and host machine.
In a previous article, I explained why using a write-back cache is quite safe now. Basically, Qemu/KVM honors any flushing operation issued by the guest, so if a guest writes sensible data and issues a flush, it can be certain that data hit the physical disk platters.
However, let me very clearly state that in some circumstances you should not use a write back cache.
The three most common reasons to not use a writeback cache are:
- one or more guests don't support write barrier (which are used by the host to decide when flushing its cache)
- you need to live-migrate VMs between multiple hosts (currently libvirt warns you to not use livemigration together with caching, or data corruption may happens)
- your workload is so cache-unfriendly that the nocache option is the better performing configuration
Point n.1 can be simply verified by looking at your guests: in a modern operating system write barriers are surely supported, if not already enabled by default. For example, Win2000 and later automatically issue a cache flush operation each second, while EXT3-based linux distributions often need to explicitly enable barriers using the “barrier=1” mount option.
Regarding live migration, it is a matter of thinking about your requirements; in most environment, it is not used.
Point n.3 can be verified only after extensive testing; however, often caching is beneficial to a wide range of workloads, so it is safe to assume that it will increase performances, rather that decreasing them.
I want to stress that I am not advocating to always, forever use caching. As stated above, there are reasonable use cases when you should not use the OS cache. Anyway, if caching brings consistent and noticeable performance improvements in the general cases, it may be worth using it. A small detour: buffering vs caching
While this page is not strictly needed for article comprehension, I feel it is important for terminology clarifications.
As you probably know, modern operating systems tend to aggressively cache data, using how much unused memory at their disposal.
Indeed, issuing the “free” command on a Linux terminal show something similar to that: total used free shared buffers cached
Mem: 7801072 210632 7590440 0 2296 23004
-/+ buffers/cache: 185332 7615740
Swap: 8388600 0 8388600
Notice the “buffers” and “cached” column: what they means?
First we should note that, in Linux, every time you write to a file your are using the pagecache, while when you write to a block device (eg: a logical volume), bypassing the filesystem, you are using buffering.
Without too much surprise, the “cached” column represents the filesystem blocks cached for later reuse (it is the so-called “pagecache”). When you read something from a file, its content ends not only in your application, but on pagecache also. When you write something, generally your writes end first in the pagecache and, only after some seconds, they hit the disks.
How about the “buffer” column? Buffers are closely related to caching, but serve a somewhat different purpose: while a cache explicitly retains data until they are stale or they are forcedly flushed, a buffer retains data only for the smallest amount of time needed to efficiently transfer data to/from the backing device. In other word, they are a necessity due to hardware constrains: for example, as small disk transfers are quite inefficient, a buffer would accumulate smaller writes until the backing block device is closed. At this point, it flush data to the backing device and release the memory allocated for buffering. On contrary, a cache would accumulate writes for much higher threshold, basically ignoring the close syscall and, in order to improve future reads, it will maintain a local copy of the written data even after they are flushed to the backing device.
As my KVM setup is using LVM-based virtual disks, you may wonder why, in the rest of the article, I speak about “cache” and not “buffer”. They point is that buffers can be effectively used as a long-term cache. Remember what I wrote above? Buffers are flushed when the underlying device is closed via a close() syscall. This means that if we don't close the device, buffers remain in place and data can be written/read directly from the them, rather than from the device. This is precisely what happens with Qemu/KVM on top of a LVM-based disk: while the qemu process is running, the buffer retain both read and written blocks, acting as a true cache. It's worth note that a simple VM reboot will not drain the buffers, as the qemu process is still running. In order to completely discard the accumulated buffers, you had to shutdown the VM (or kill the qemu process running it). This is the only significant difference between the buffered-backed LVM virtual disk and a real pagecache-backed file-based virtual disk: in this latter case, a shutdown will not drain the cache, so a subsequent VM start benefits from the old, still valid, data in cache.
In short: while I am using LVM-based virtual disks that are not strictly pagecached-backed, the current Linux's buffers implementation is, in this case, very similar to a classical cache. But if they are the same, why spend and entire page arguing about the terminology? The answer is simple: historically, pagecache was somewhat more CPU-hungry then buffering. The difference is very small, at a point that with a modern CPU it is negligible, but I am quite picky when describing benchmark results :)
Testbed and methods
Benchmarks were performed on a system equipped with:
- PhenomII 940 CPU (4 cores @ 3.0 GHz, 1.8 GHz Northbridge and 6 MB L3 cache)
- 8 GB DDR2-800 DRAM (in unganged mode)
- Asus M4A78 Pro motherboard (AMD 780G + SB700 chipset)
- 4x 500 GB hard disks (1x WD Green, 3x Seagate Barracuda) in AHCI mode, configured in software RAID10 "near" layout
- S.O. CentOS 6.5 x64
The operation system was installed with “basic server” profile and then I selectively installed the other softwares required (libvirtd, qemu, etc). Key systems softwares were:
- kernel-2.6.32-431.1.2.0.1.el6.x86_64
- qemu-kvm-0.12.1.2-2.415.el6_5.3.x86_64
- libvirt-0.10.2-29.el6_5.2.x86_64
To test KVM in a true multi-guests environment, I created a basic “tile” of four guests, each with VirtIO drivers in place (for both disk and network devices). A tile is composed by:
- two (#1 and #2) Windows Server 2012 R2 64 bit guests, each with 1 GB RAM and 32 GB disk
- two CentOS 6.5 x86_64 guests (#3 and #4), each with 512 MB RAM and 8 GB disk.
All virtual machines use LVM-based disks, carved out by a dedicated volume group.
Inside the tile, each VM has the following role:
- the two (#1 and #2) Windows Server 2012 R2 64 bit guests act as fileservers. The first Win2012 guest copies, via SMB/CIFS, a ~670 MB directory (with over 44500 files) on the second Win2012 guest. After 30 seconds of idling, it copies back the directory from the peer Win2012 machine.
- the first CentOS 6.5 x86_64 guest (#3) acts as a dynamic web and email server (using apache, mysql and postfix). This machine serves a Joomla 3.2.5 site. At the same time, it runs a postgresql benchmark (sysbench) against the fourth guest, issuing a total of 10.000 transactions with a concurrency level of 4.
- the second CentOS 6.5 x86_64 guest (#4) acts as a pure database server (using postgresql). This guest is benchmarked by the previous CentOS VM, and at the same time it runs AB (apache benchmark) to stress it, issuing 2.000 requests with a concurrency level of 4. Moreover, it run a shell script generating 100 batches of 5 emails, each of ~56 KB, with one second wait between each batch. Finally, it sends 100 of those emails in a single, big burst. Totally, it moves about 34 MB of data.
In short, those VMs benchmark each other. This ensure not only that the test is self-contained, without externally-induced variables, but it also stress the internal virtual network switch created by Qemu.
I perfectly understand that I am testing very specific scenarios, so let me know what you, the reader, think about that. Do you want a more web-specific test case? Your focus is on database performance? Or fileserver speed is all that matter to you?
Let me know your ideas!
Total benchmarks run time
This article focuses on how well the host machine manage an ever increasing number of virtual machines. In order to present you realistic results, I run the benchmark using 1, 2 or 3 tiles (4, 8 or 12 VMs).
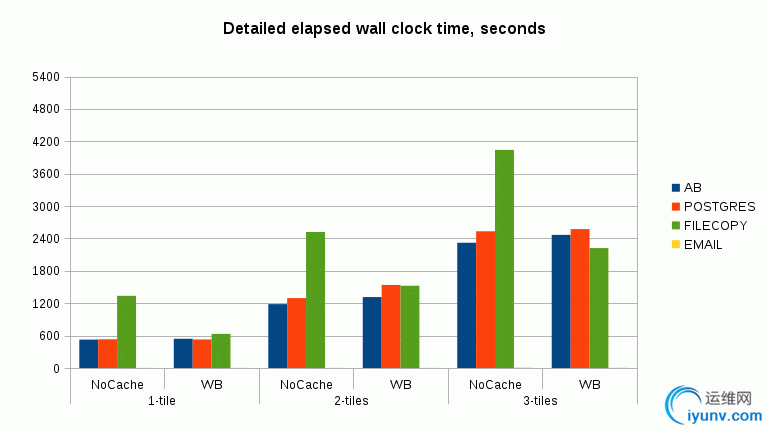
The first graph depicts total wall-clock run time, ie how much time a complete benchmark run needs:

This first result is eloquent: enabling the write-back cache translates in much lower execution time, at a point that a 3-tile setup (12 virtual machines) performs better than a 2-tiles setup (8 virtual machines) without caching.
But where the wb-enabled case gains the most?

As you can see, is the filecopy benchmark the speedup the most. This was expected: apache benchmark is basically CPU-bound, while sysbench's complex test is fsync-write bound, a situation where a writeback cache is of little help. Still, the increased filecopy speed is a very nice bonus.
Did you notice how emails seem to basically take no time? It depend on how the SMTP protocol works: even when overloaded by other activities, postfix try hard to queue all incoming emails for later delivery. This delayed delivery phase is not directly timed, but it is another source of fsync-heavy writes.
Host scaling: CPU
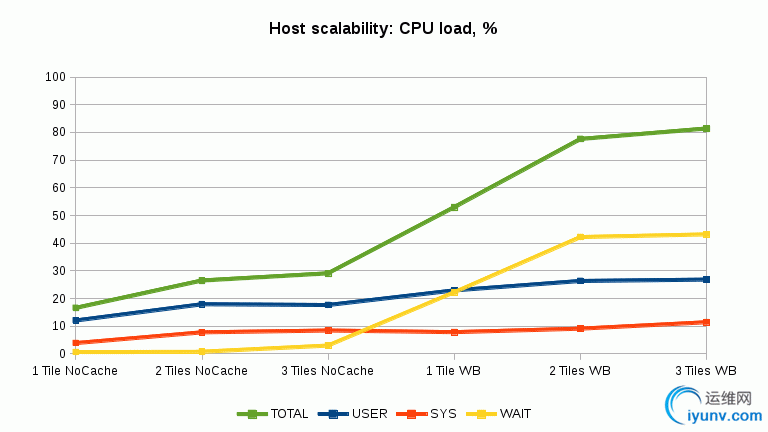
How the host responds to the ever-increasing load? Lets start from CPU scaling:

At first, it seems that the write-back cache comports a noticeable toll on CPU performance: even accounting for the increased speed, total CPU load is quite high.
However, a deeper analysis show that increased CPU load is really due to the increased WAIT time, which is the time the CPU is spending waiting for the I/O subsystem to catch-up.
Hey, wait a moment (no pun intended): why enabling the wb cache actually results in increased disk WAIT time? The fact is that the writeback cache enables much more parallelism in the I/O stack, resulting in the disk working much harder, and more threads are concurrently marked as “executable” by the scheduler.
While CPU is waiting for I/O to complete, the process requesting the I/O operation is blocked, but the CPU is free to execute another thread. This means that real CPU load should be obtained summing USER and SYS loads, and in this case we see only a very mild increase in CPU load between the nocache and wb-cache scenarios (perfectly justified by the increased performance).
In short: enabling the write-back cache is a non-issue from a CPU standpoint, at least when using buffered I/O (as is the case with direct access to LVM-based disks).
Host scalability: disks load
We previous stated that enabling the write-back cache led to increased disk performance. The following chart proves our affirmation:

The wb-enabled tiles have similar disk utilization than the no-cache ones, but they provide superior speed: if we normalize for performance, write-back cache provide much higher efficiency.
Lets spends some word on the increased average access time (await). What happens here? The answer is simple: as the write-back cache enable more I/O threads to be concurrency active, total throughput is higher but at the same time the average single-request access time grows.
Don't let await fear you: when the cache is disabled, the running threads enjoy lower access time, but you have a lower total number of I/O active threads. If your application depends on multiple, concurrent I/O write operations, it will be condemned to serially executing many of them, leading to the perception of a slower system. Enabling the wb-cache give your application a real chance to execute multiple concurrently I/O writes, and the host system can even coalesce some of them.
So, while in some specific, controlled, low-latency workload the nocache configuration can be the better choice, generally the write-back cache is the preferred one.
Detailed disk perf data:

The wb-enabled cases show much higher read and write speeds, indeed.
Host scalability: memory utilization
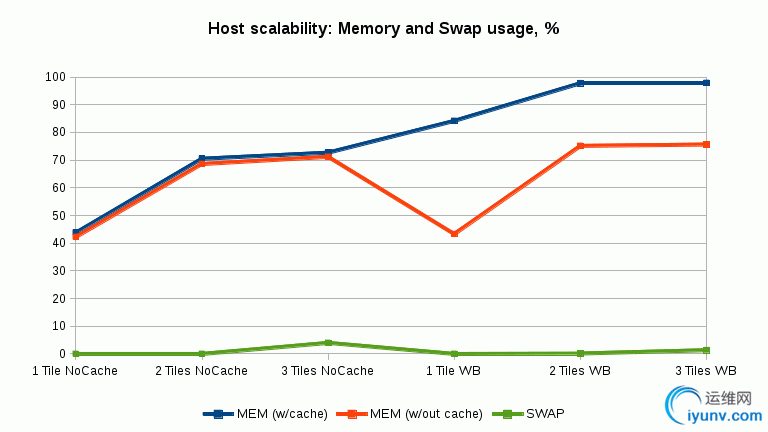
Do using some RAM for caching lowers total free memory? Lets check:

This chart really need an explanation. The “MEM (w/cache)” line shows total system memory usage, while the “MEM (w/out cache)” shows real memory utilization. The key concept here is that for Linux (and other modern OSes are the same) the memory used for caching and/or buffering is not really maked as “used memory”, as it can readily freed at any time.
So, real memory utilization is depicted by the red line. Watching this line, you can see that the wb-cache is no more memory-hungry that the nocache configuration.
In other words: Linux only engages unused memory for caching and, when an application requires more free memory, it immediately deallocs cache for giving the application the requested memory.
The careful reader should have a question now: how it is possible for a 8 GB host machine to happily run as much as 12 virtual machines, for a total estimated guest memory usage of over 9 GB, without heavy swapping? The answer lie in a very useful Linux feature, called KSM (kernel samepage merging). KSM enable the host system to periodically check for duplicate memory chunks, and to deduplicate them when found. In short, if two memory locations have the same content, KSM marks the first location as a CoW (copy-on-write) one, and frees the second location. If an application want to modify the shared location, the system first re-duplicate it, and then modify the newly-created location.
In practice KSM works surprisingly well, especially for short-lived Windows machines: as Windows has the habit of zeroing all free memory at startup, KSM has plenty of opportunities to coalesce these zeroed pages.
Conclusions
It is clear that enabling caching/buffering is very beneficial to the specific workload tested in this article. Cache led to much higher disk usage and, as often the disk subsystem is the weak link of any server, this mean higher potential consolidation ratio. The story don't ends here, obviously: sometime RAM capacity plays an even bigger role in defining max consolidation ratio. And Linux is very well equipped in this area, thanks to KSM. |
|